How To Create Isometric Diagrams Using SVG
Looking to build interactive isometric diagrams? Here's a method to create and implement them using the open-source library JointJS.
Join the DZone community and get the full member experience.
Join For FreeThere are various methods of visualizing three-dimensional objects in two-dimensional space. For example, most 3D graphics engines use perspective projection as the main form of projection. This is because perspective projection is an excellent representation of the real world, in which objects become smaller with increasing distance. But when the relative position of objects is not important, and for a better understanding of the size of objects, you can use parallel projections. They are more common in engineering and architecture, where it is important to maintain parallel lines. Since the birth of computer graphics, these projections have been used to render 3D scenes when 3D rendering hardware acceleration was not possible. Recently, various forms of parallel projections have become a style choice for digital artists, and they are used to display objects in infographics and in digital art in general.
The purpose of this article is to show how to create and manipulate isometric views in SVG and how to define these objects using, in particular, the JointJS library. To illustrate SVG’s capabilities in creating parallel projections, we will use isometric projection as an example. This projection is one of the dominant projection types because it allows you to maintain the relative scale of objects along all axes.
Isometric Projection
Let’s define what isometric projection is. First of all, it is a parallel type of projection in which all lines from a “camera” are parallel. It means that the scale of an object does not depend on the distance between the “camera” and the object. And specifically, in isometric (which means “equal measure” in Greek) projection, scaling along each axis is the same. This is achieved by defining equal angles between all axes.
In the following image, you can see how axes are positioned in isometric projection. Keep in mind that in this article, we will be using a left-handed coordinate system.

One of the features of the isometric projection is that it can be deconstructed into three different 2D projections: top, side, and front projections. For example, a cuboid can be represented by three rectangles on each 2D projection and then combined into one isometric view. The next image represents separate projections of an object using the left-handed coordinate system.
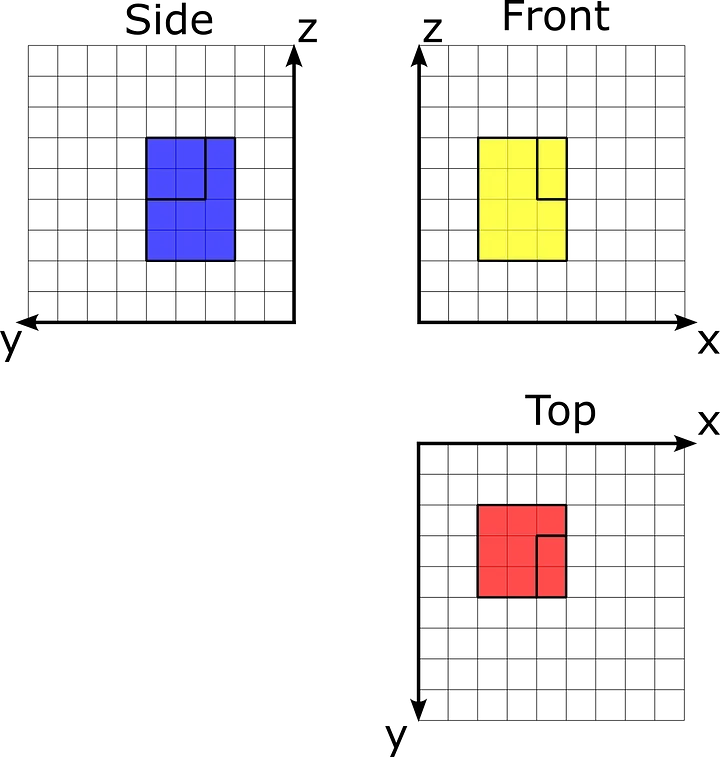
Separate views of the orthographic projection
Then, we can combine them into one isometric view:
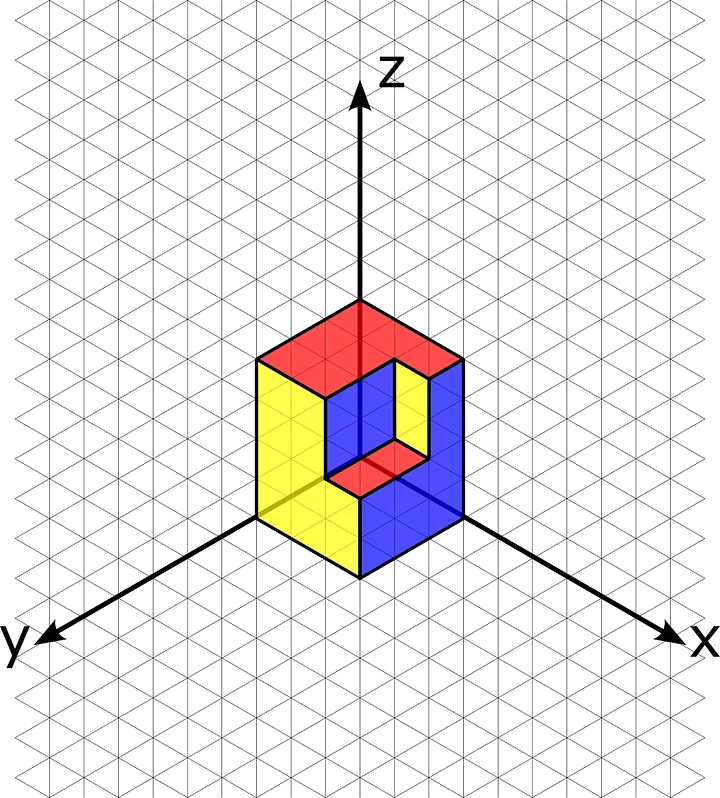
Isometric view of the example object
The challenge with SVG is that it contains 2D objects which are located on one XY-plane. But we can overcome this by combining all projections in one plane and then separately applying a transformation to every object.
SVG Isometric View Transformations
In 3D, to create an isometric view, we can move the camera to a certain position, but SVG is purely a 2D format, so we have to create a workaround to build such a view. We recommend reading Cody Walker’s article that presents a method for creating isometric representations from 2D object views — top, side, and front projections. Based on the article, we need to create transformations for each 2D projection of the object separately.
First, we need to rotate our plane by 30 degrees. And then, we will skew our 2D image by -30 degrees. This transformation will align our axes with the axes of the isometric projection.
Then, we need to use a scale operator to scale our 2D projection down vertically by 0.8602. We need to do it due to the fact of isometric projection distortion.
Let’s introduce some SVG features that will help us implement isometric projection. The SVG specification allows users to specify a particular transformation in the transform attribute of an SVG element. This attribute helps us apply a linear transformation to the SVG element. To transform 2D projection into an isometric view, we need to apply scale, rotate, and skew operators.
To represent the transformation in code, we can use the DOMMatrixReadOnly object, which is a browser API, to represent the transformation matrix. Using this interface, we can create a matrix as follows:
const isoMatrix = new DOMMatrixReadOnly()
    .rotate(30)
    .skewX(-30)
    .scale(1, 0.8602);
This interface allows building a transformation matrix using our values, and then we can apply the resulting value to thetransform attribute using the matrix function.
In SVG, we can present only one 2D space at a time, so for our conversion, we will be using top projection as a base projection. This is mostly because axes in this projection correspond with axes in a normal SVG viewport.
To demonstrate SVG possibilities, we will be using the JointJS library. We defined a rectangular grid in the XY-plane with a cell width of 20. Let’s define SVG for the elements on the top projection from the example. To properly render this object, we need to specify two polygons for two levels of our object. Also, we can apply a translate transformation for our element in 2D space using DOMMatrix:
// Translate transformation for Top1 Element
const matrix2D = new DOMMatrixReadOnly()
.translate(200, 200);<!--Top1 element-->
<polygon joint-selector="body" id="v-4"
stroke-width="2" stroke="#333333" fill="#ff0000"
fill-opacity="0.7" points="0,0 60,0 60,20 40,20 40,60 0,60"
transform="matrix(1,0,0,1,200,200)">
</polygon>
<!--Top2 element-->
<polygon joint-selector="body" id="v-6"
stroke-width="2" stroke="#333333" fill="#ff0000"
fill-opacity="0.7" points="0,0 20,0 20,40 0,40"
transform="matrix(1,0,0,1,240,220)">
</polygon>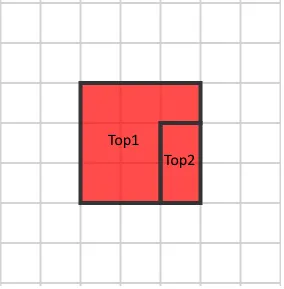
Then, we can apply our isometric matrix to our elements. Also, we will add a translate transformation to position elements in the right place:
const isoMatrix = new DOMMatrixReadOnly()
    .rotate(30)
    .skewX(-30)
    .scale(1, 0.8602);

const top1Matrix = isoMatrix.translate(200, 200);
const top2Matrix = isoMatrix.translate(240, 220);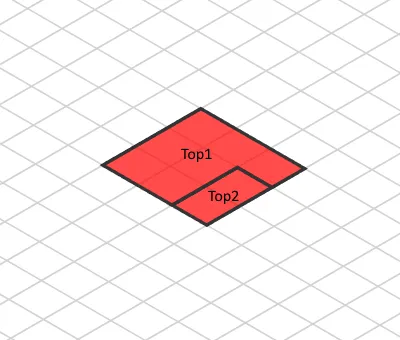
Isometric view without height adjustment
For simplicity, let’s assume that our element’s base plane is located on the XY plane. Therefore, we need to translate the top view so it will be viewed as it is located on the top of the object. To do it, we can just translate the projection by its Z coordinate on the scaled SVG space as follows. The Top1 element has an elevation of 80, so we should translate it by (-80, -80). Similarly, the Top2 element has an elevation of 40. We can just apply these translations to our existing matrix:
const top1MatrixWithHeight = top1Matrix.translate(-80, -80);
const top2MatrixWithHeight = top1Matrix.translate(-40, -40);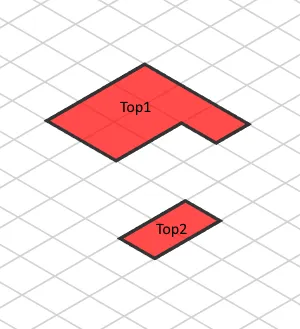
Final isometric view of top projection
In the end, we will have the following transform attributes for Top1 and Top2 elements. Note that they differ only in the two last values, which represent the translate transformation:
// Top1 element
transform="matrix(0.8660254037844387,0.49999999999999994,-0.8165000081062317,0.47140649947346464,5.9,116.6)"

// Top2 element
transform="matrix(0.8660254037844387,0.49999999999999994,-0.8165000081062317,0.47140649947346464,26.2,184.9)"
To create an isometric view of side and front projections, we need to make a net so we can place all projections on 2D SVG space. Let’s create a net by attaching side and front views similar to the classic cube net:
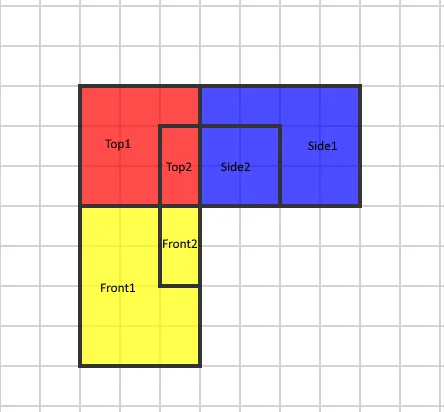
Then, we need to skewX side and front projections by 45 degrees. It will allow us to align the Z-axis for all projections. After this transformation, we will get the following image:
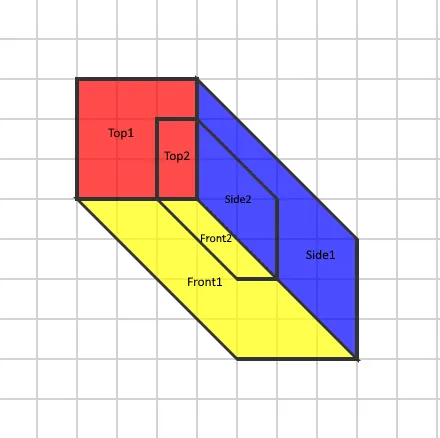
Prepared 2D projection
Then, we can apply our isoMatrix to this object:

Isometric projection without depth adjustments
In every projection, there are parts that have a different 3rd coordinate value. Therefore, we need to adjust this depth coordinate for every projection as we did with the top projection and its Z coordinate. In the end, we will get the following isometric view:
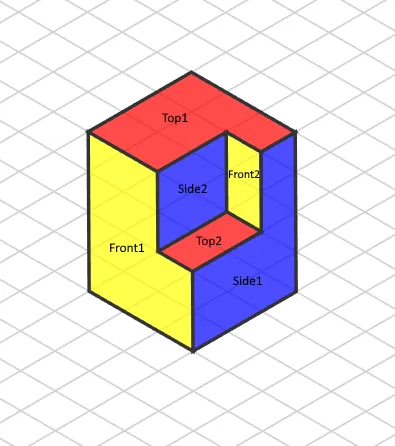
Final isometric view of the object
Using JointJS for the Isometric Diagram
JointJS allows us to create and manipulate such objects with ease due to its elements framework and wide set of tools. Using JointJS, we can define and control isometric objects to build powerful isometric diagrams.
Remember the basic isometric transformation from the beginning of the article?
const isoMatrix = new DOMMatrixReadOnly()
    .rotate(30)
    .skewX(-30)
    .scale(1, 0.8602);
In the JointJS library, we can apply this transformation to the whole object which stores all SVG elements, and then simply apply the object-specific transformations on top of this.
Isometric Grid Rendering
JointJS has great capabilities in the rendering of custom SVG markup. Utilizing JointJS, we can generate a path that is aligned to an untransformed grid and have it transformed automatically with the grid, thanks to the global paper transformation that we mentioned previously. You can see the grid and how we interpret the coordinate system in the demo below. Note that we can dynamically change the paper transformation, which allows us to change the view on the fly:

Creating a Custom Isometric SVG Element
Here, we show a custom SVG Isometric shape in JointJS. In our example, we use the isometricHeight property to store information about a third dimension and then use it to render our isometric object. The following snippet shows how you can call the custom createIsometricElement function to alter object properties:
const element = createIsometricElement({
    isometricHeight: GRID_SIZE * 3,
    size: { width: GRID_SIZE * 3, height: GRID_SIZE * 6 },
    position: { x: GRID_SIZE * 6, y: GRID_SIZE * 6 }
});
In the following demo, you can see that our custom isometric element can be moved like an ordinary element on the isometric grid. You can change dimensions by altering the parameters of the createIsometricElement function in the source code (when you click “Edit on CodePen”):
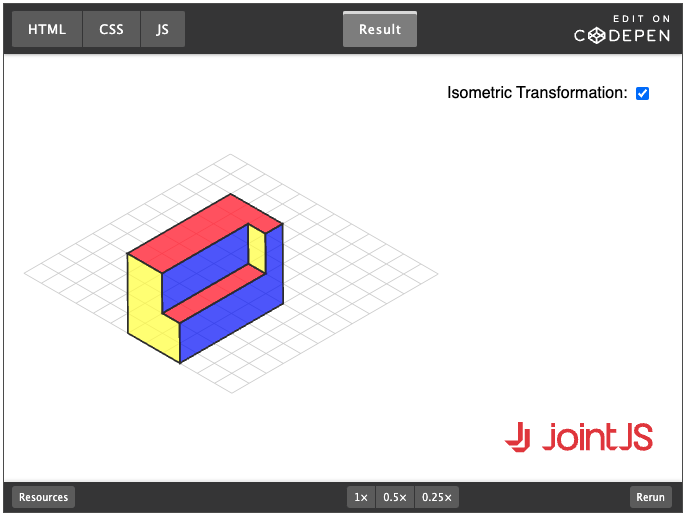
Z-Index Calculation in Isometric Diagrams
One of the problems with an isometric view is placing elements respective to their relative position. Unlike in a 2D plane, in an isometric view, objects have perceived height and can be placed one behind the other. We can achieve this behavior in SVG by placing them into the DOM in the right order. To define the order in our case, we can use the JointJS z attribute, which allows sending the correct element to the background so that it can be overlapped/hidden by the other element as expected. You can find more information about this problem in a great article by Andreas Hager.
We decided to sort the elements using the topological sorting algorithm. The algorithm consists of two steps. First, we need to create a special graph, and then we need to use a depth-first search for that graph to find the correct order of elements.
As the first step, we need to populate the initial graph — for each object, we need to find all objects behind it. We can do that by comparing the positions of their bottom sides. Let’s illustrate this step with images — let’s, for example, take three elements which are positioned like this:
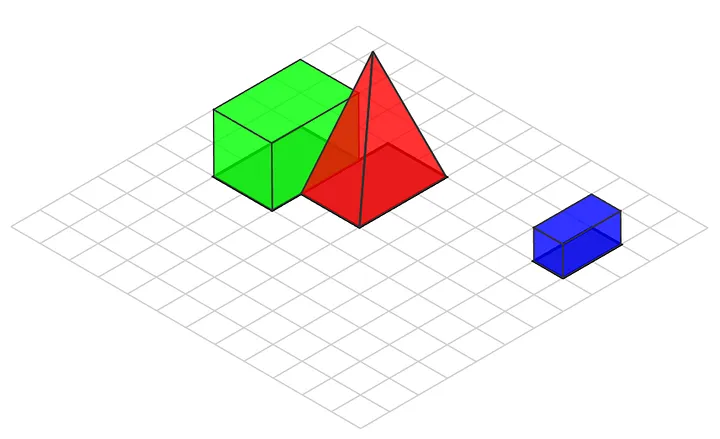
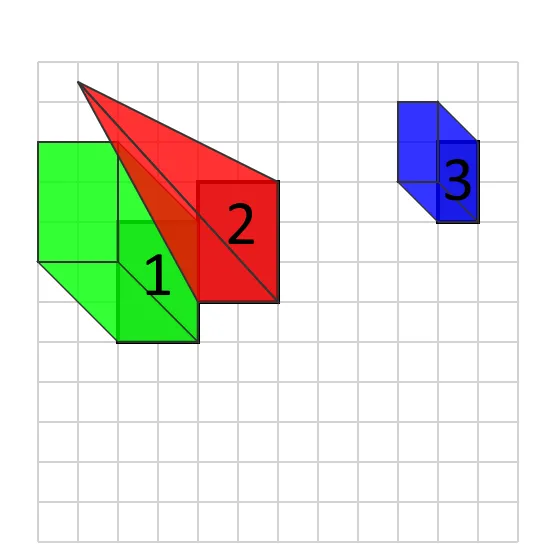
We have marked the bottom side of each object in the second image. Using this data, we will create a graph structure that will model topological relations between elements. In the image, you can see how we define the points on the bottom side — we can find the relative position of all elements by comparing aMax and bMin points. We define that if the x and y coordinates of point bMin are less than the coordinates of point aMax , then object b is located behind object a.
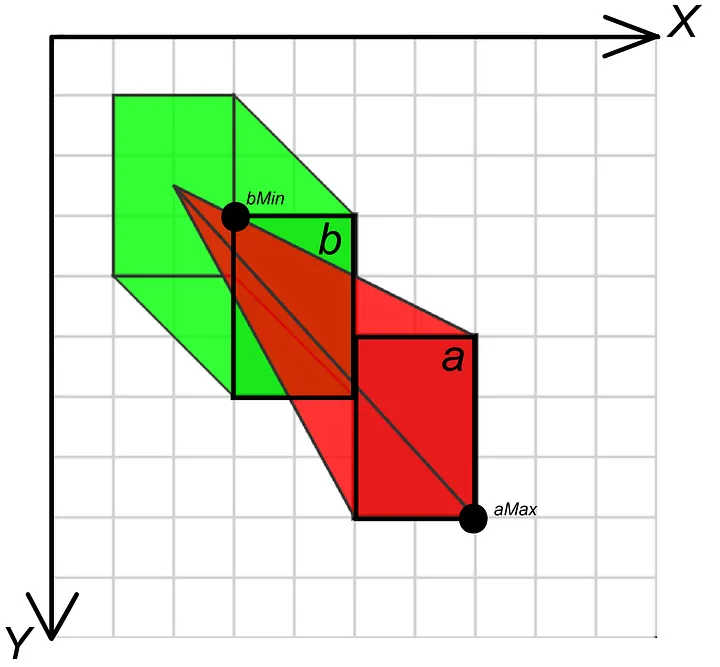 Algorithm data in a 2D space
Comparing the three elements from our previous example, we can produce the following graph:
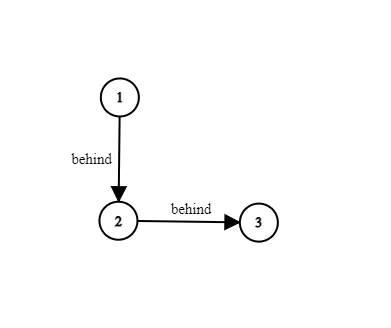
Topological graph
After that, we need to use a variation of the depth-first search algorithm to find the correct rendering order. A depth-first search allows us to visit graph nodes according to the visibility order, starting from the most distant one. Here is a library-agnostic example of the algorithm:
const sortElements = (elements: Rect[]) => {
    const nodes = elements.map((el) => {
        return {
            el: el,
            behind: [],
            visited: false,
            depth: null,
        };
    });

    for (let i = 0; i < nodes.length; ++i) {
        const a = nodes[i].el;
        const aMax = aBBox.bottomRight();

        for (let j = 0; j < nodes.length; ++j) {
            if (i != j) {
                const b = nodes[j].el;
                const bMin = bBBox.topLeft();
                if (bMin.x < aMax.x && bMin.y < aMax.y) {
                    nodes[i].behind.push(nodes[j]);
                }
            }
        }
    }

    const sortedElements = depthFirstSearch(nodes);
    return sortedElements;
};

const depthFirstSearch = (nodes) => {
    let depth = 0;
    let sortedElements = [];

    const visitNode = (node) => {
        if (!node.visited) {
            node.visited = true;

            for (let i = 0; i < node.behind.length; ++i) {
                if (node.behind[i] == null) {
                    break;
                } else {
                    visitNode(node.behind[i]);
                    delete node.behind[i];
                }
            }

            node.depth = depth++;
            sortedElements.push(node.el);
        }
    };

    for (let i = 0; i < nodes.length; ++i) {
        visitNode(nodes[i]);
    }

    return sortedElements;
};
This method can be implemented easily using the JointJS library — in the following CodePen, we use a special JointJS event to recalculate z-indexes of our elements whenever the position of an element is changed. As outlined above, we use a special z property of the element model to specify rendering order and assign it during the depth-first traversal. (Note that the algorithm’s behavior is undefined in the case of intersecting elements due to the nature of the implementation of isometric objects.)
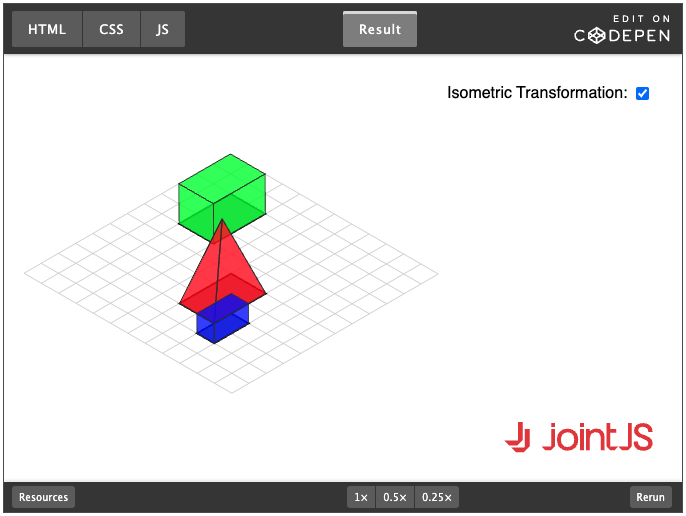
The JointJS Demo
We have created a JointJS demo that combines all of these methods and techniques and also allows you to easily switch between 2D and isometric SVG markup. Crucially, as you can see, the powerful features of JointJS (which allow us to move elements, connect them with links, and create tools to edit them, among others) work just as well in the isometric view as they do in 2D.
You can see the demo here.
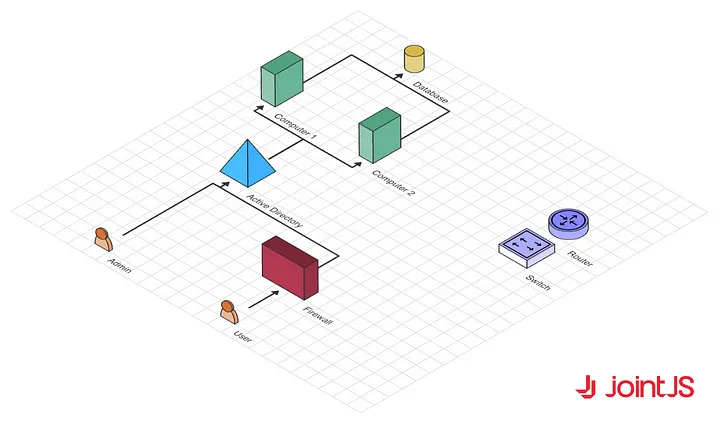
Throughout this article, we used our open-source JointJS library for illustration. However, since you were so thorough with your exploration, we would like to extend to you an invitation to our no-commitment 30-day trial of JointJS+, an advanced commercial extension of JointJS. It will allow you to experience additional powerful tools for creating delightful diagrams.
Published at DZone with permission of Arthur Khokhlov. See the original article here.
Opinions expressed by DZone contributors are their own.

Comments